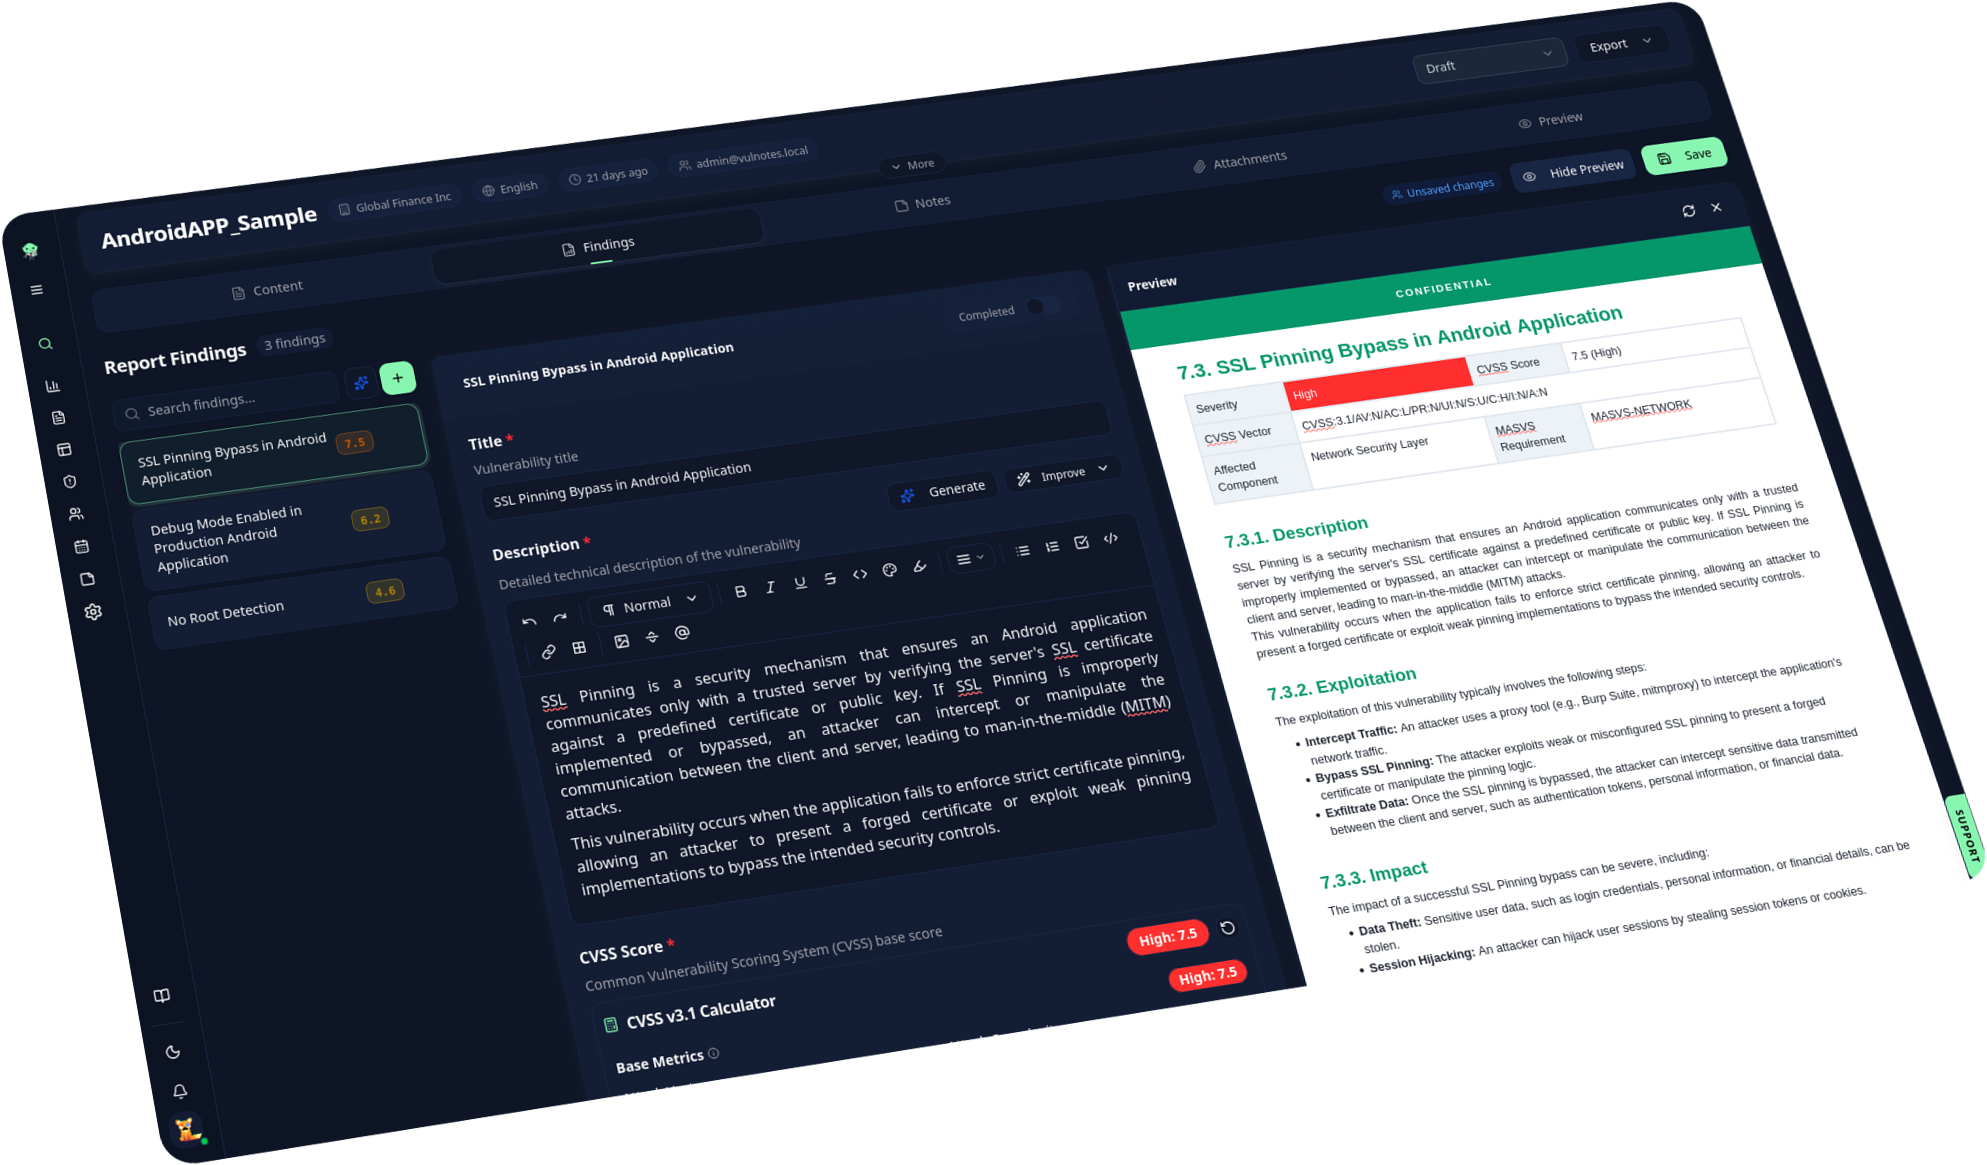
Pentest Report Templates.Pixel-Perfect in Your Browser.
The only collaborative drag-and-drop document designer for your report.
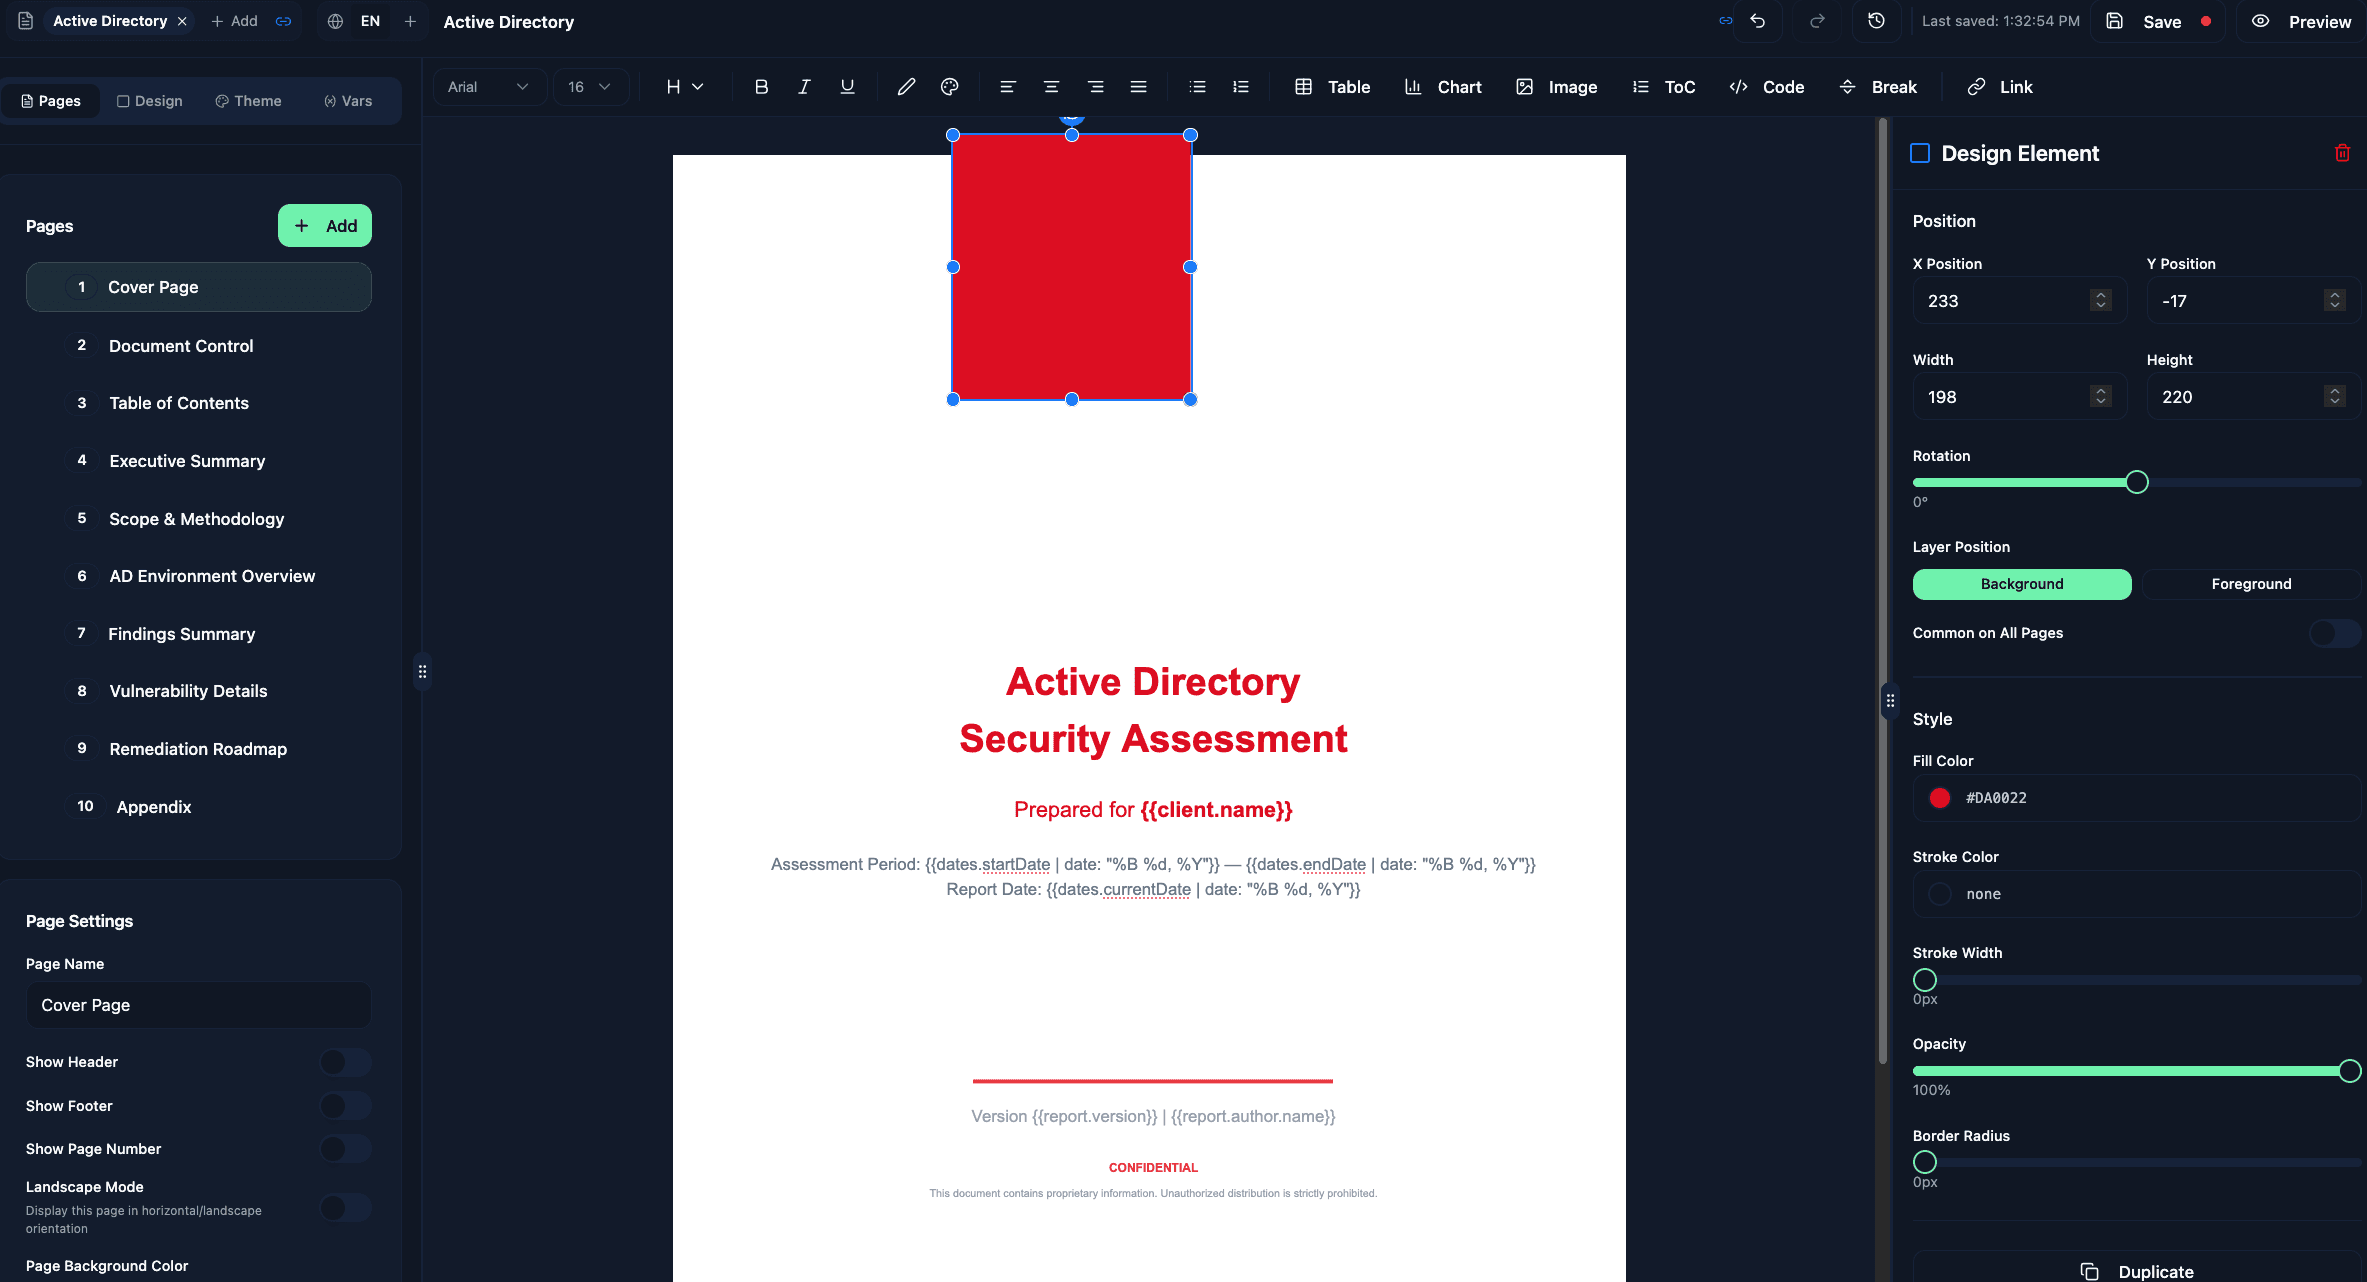
Integrated Drag-and-Drop Report Designer
Lay out cover pages, finding sections and annexes visually. Every element is placed exactly where you drop it, on a single page or across all pages, with full control over how layers stack. And you design together: teammates edit the same template at the same time, with live cursors and per-page presence.
- Shapes, images, charts, styled tables, code blocks and table of contents
- Rotate, resize and layer any element with z-index control
- Place elements per page or once for all pages
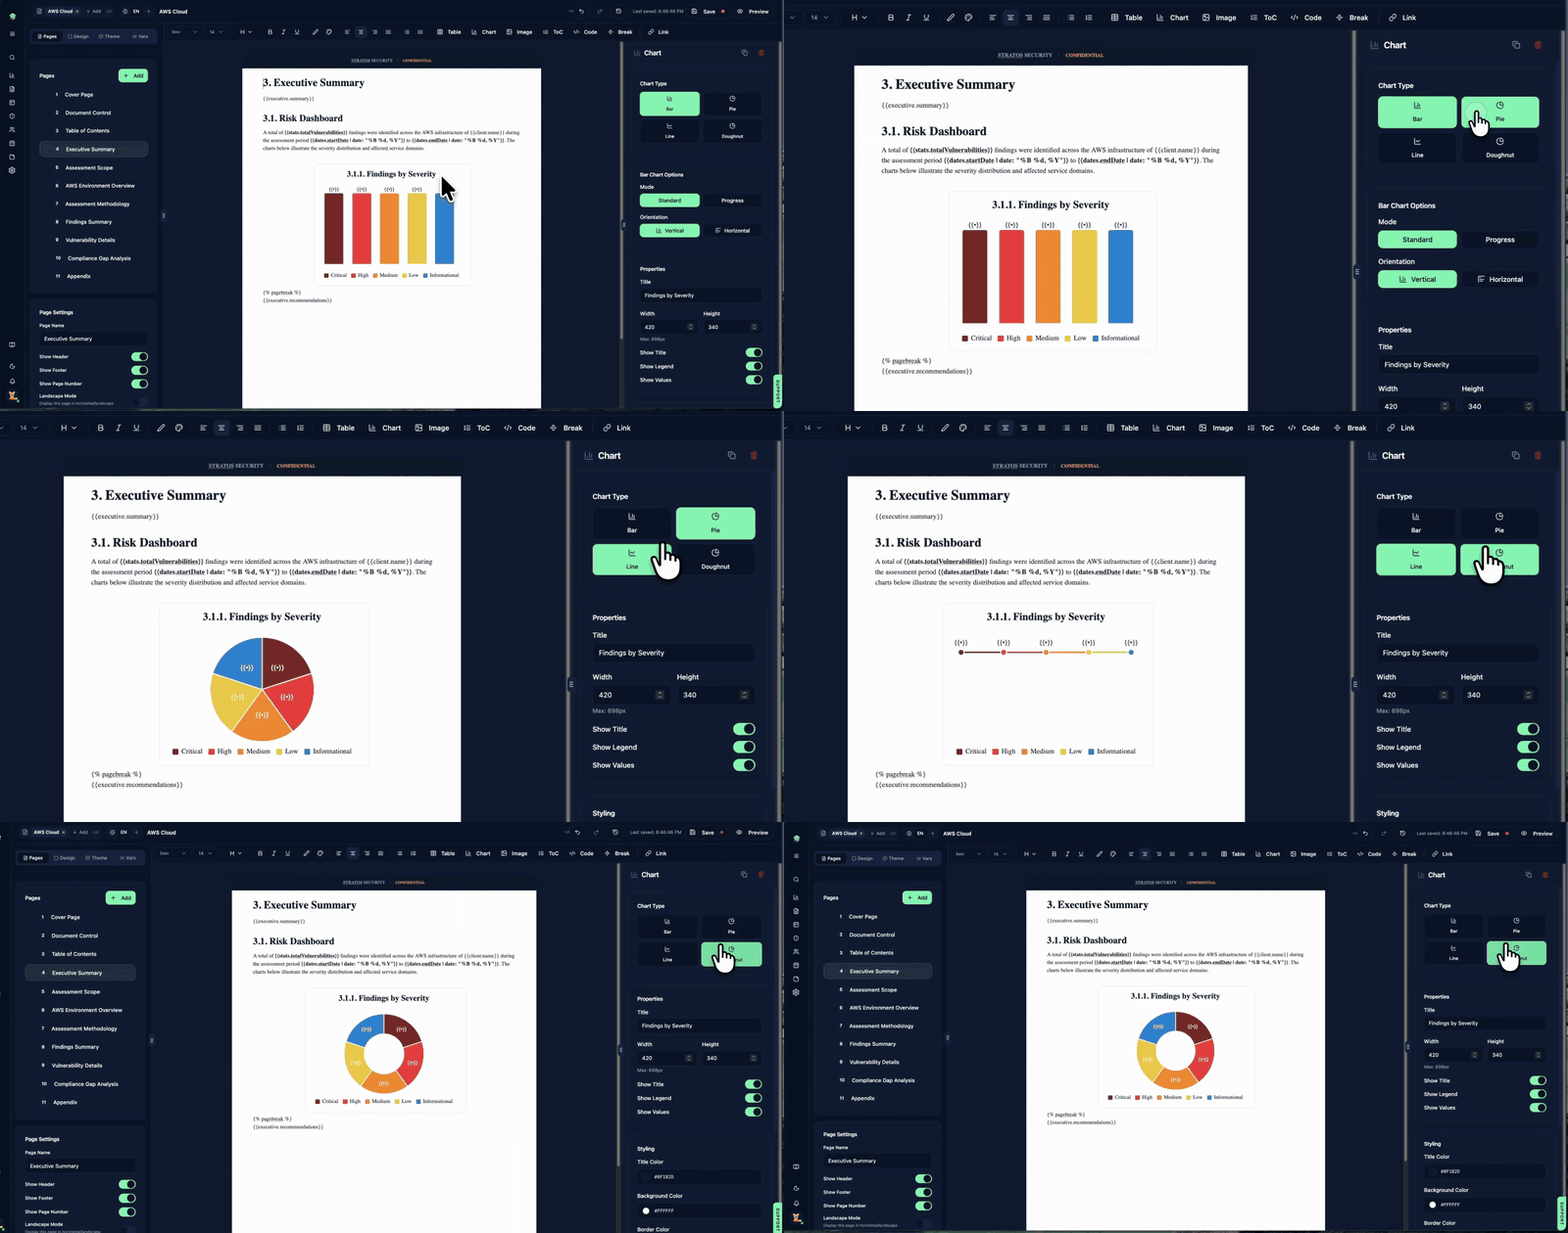
Charts and Tables That Follow the Data
Dynamic charts and severity-colored tables are driven by the report data, so the deliverable always matches the findings.
- Bar, pie, line and doughnut charts, populated live from report data
- Severity-colored tables and text, driven by your findings
- Set one reference table's style and every table in the report follows
One Report, Two Deliverables
Every page sets its own orientation, so you can build a landscape deck template styled as slides next to your document template for the same type of engagement. A report can switch templates after creation: export the formal report, switch, and export the deck for the client debrief.
- Per-page orientation mixes portrait and landscape in one template
- Switch a report's template at any time, no data re-entry
- One engagement, two exports: the document and the presentation deck
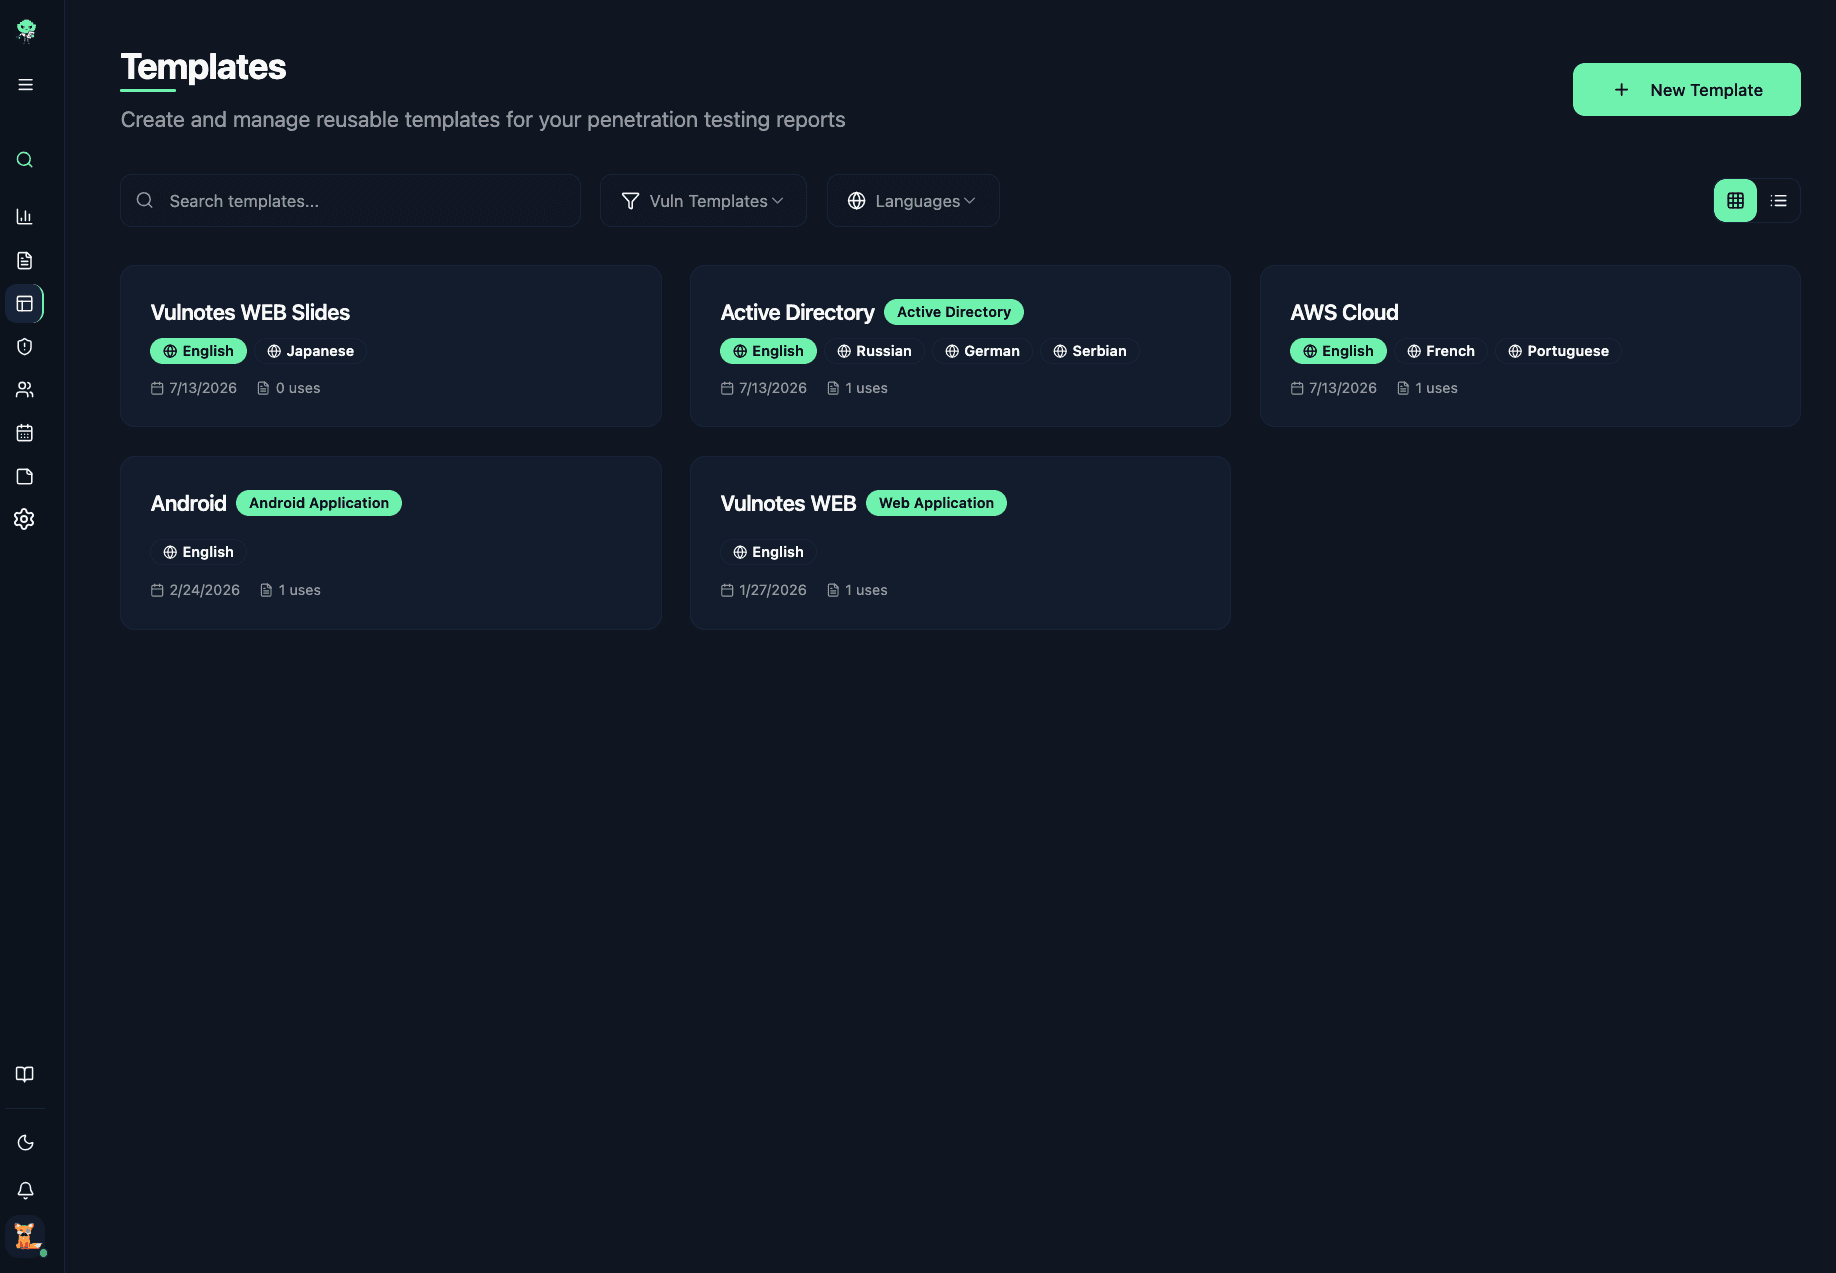
Multilingual Template Groups
One template, every language your clients speak. Add a language variant in one action: it stays grouped with the original and shares its name and vulnerability type. With the multilingual reporting beside it, the whole engagement changes language, not just the layout.
{% for vuln in vulnerabilities %}
  {{ vuln.title }}
  Severity: {{ vuln.severity }}
{% endfor %}{% if stats.criticalCount > 0 %}
{{ stats.criticalCount }} critical vulnerabilities found.
{% elsif stats.highCount > 0 %}
{{ stats.highCount }} high vulnerabilities found.
{% else %}
No critical or high vulnerabilities found.
{% endif %}{{ vuln.severity | severityColor }}
{{ vuln.severity | severityBackgroundColor }}LiquidJS Variables for Every Report Field
Every variable pulls live report data into your layout: the client name on the cover page, dates and scope in the header, severity counts in the executive summary. Loops write the findings table for you, one row per vulnerability, with cells colored by severity. Conditionals adapt the wording to the results. And for the parts only a human can write, define your own custom variables: editable sections your team fills in per engagement, straight from the report editor.
- Full syntax: if, elsif, unless and case conditionals, loops with sort_by, limit and offset, assign for local variables
- Filters for date formatting, CVSS scores and metrics, severity color mapping and value mapping, plus the standard Liquid set
- Live expression tester runs your syntax against the actual report context
The Small Stuff Is Built In
Revision history records changes and allow reverting to previous versions.
Set brand colors and type once, reuse them across the template.
Move templates between instances or share them with your team.
Start from a template and make it yours.
The template library ships free and easy to adapt report templates with unedited PDF previews. Adapt a ready-made layout to your branding, content and workflow.